Chart the Course.

Data strategy and analytics portfolio. From insight to decision.

8 Brand Portfolio
$50M+ Revenue Managed
12+ Live Dashboards
4yr Longitudinal Depth
Filter 11 projects
DTC Revenue Decline Dashboard
Root Cause Analysis

DTC Revenue Decline Investigation

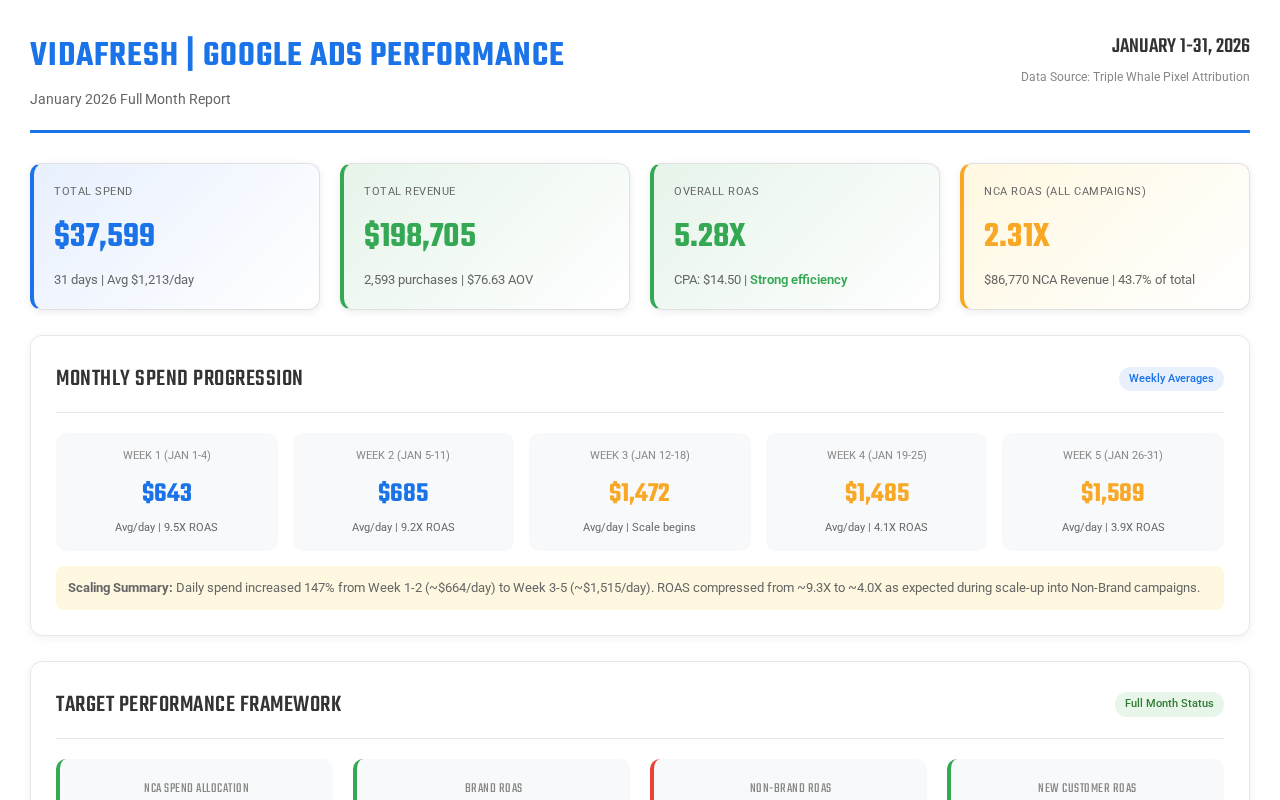
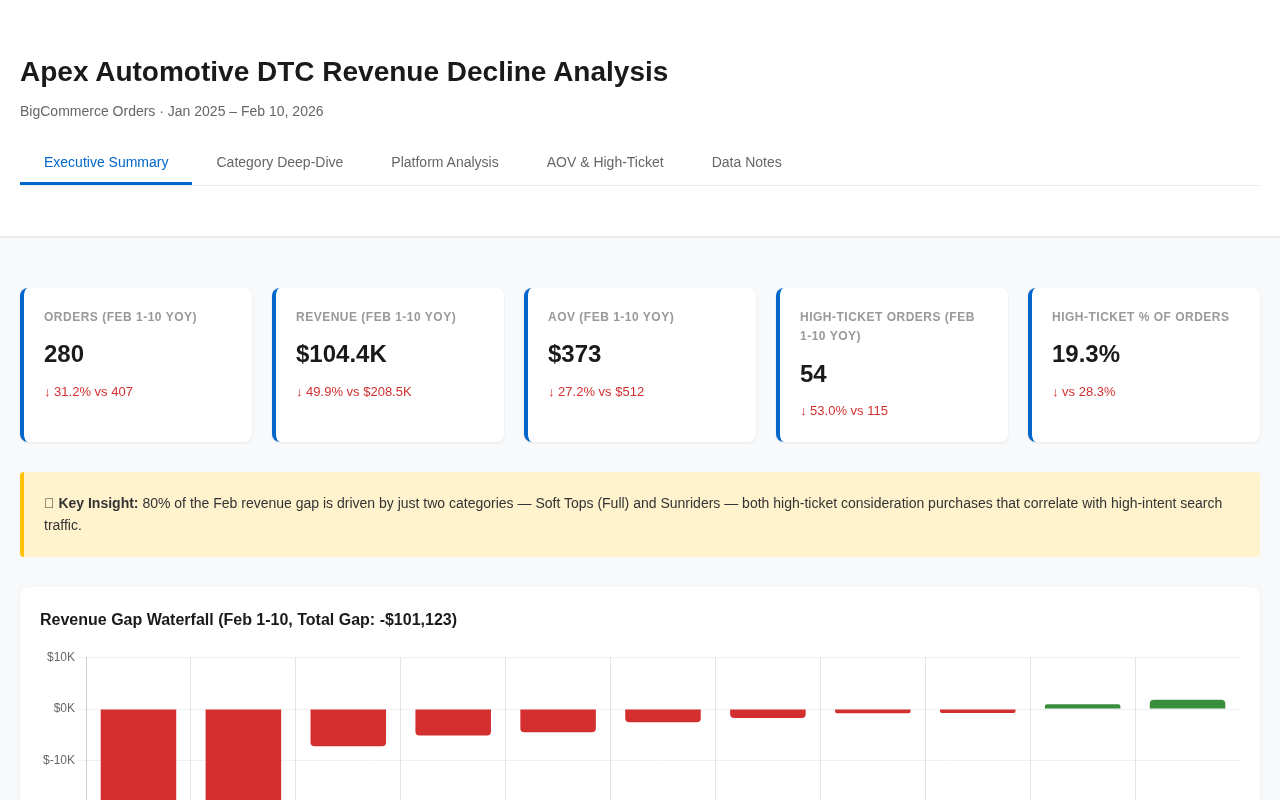
Diagnosed 42-50% YoY revenue decline through product-tier segmentation. Isolated 53% high-ticket order collapse as root cause, directly driving $240K+ pre-seasonal budget restoration.

● Order-level analysis ● Budget impact
CPG Monthly Dashboard
Cross-Client Work

CPG Brand Monthly Performance

Full-month performance dashboard for a CPG/Beverage brand. Demonstrates portfolio breadth beyond automotive vertical with channel-level analysis and pacing metrics.

● CPG vertical ● Monthly cadence
Audience Strategy Deck
Audience & Strategy

Audience Strategy & Targeting Framework

Client-facing audience segmentation and targeting strategy. Research-backed persona development with channel recommendations and budget allocation framework.

● Client executive ● Strategy deck
DCX Wrapped Presentation
Teaching & Communication

DCX Wrapped 2025 — Semester Review

Spotify Wrapped-style semester retrospective for Digital Customer Experience course at University of Missouri. Data storytelling applied to education metrics.

● Data storytelling ● University of Missouri
Analytics dashboard with charts
Investigative Analytics

4-Year GA4 User Acquisition Investigation

Longitudinal channel analysis across 4 years of GA4 data revealing an 85.7% paid search acquisition collapse. Reframed client strategy from tactical optimization to structural recovery.

● 5-tab dashboard ● GA4 · GTM ● Client-facing
Analytics data on screen
Attribution & Channel

Google Ads Longitudinal Performance Analysis

4-year January comparison revealing channel mix evolution from Search-dominant to PMax-dominant, with ROAS improving 4.45x to 11.34x while total revenue opportunity contracted.

● Campaign-level detail ● ROAS trends
Multi-screen data command center
Executive Reporting

Multi-Brand Executive Dashboard

TACOS performance grid, platform ROAS comparison (Google vs. Meta), and portfolio-level KPIs. Designed for C-suite consumption with YoY benchmarking across 8 brands.

● 8-brand portfolio ● C-suite audience
Performance charts and graphs
Performance Analytics

Portfolio Performance Dashboard

Brand-level drill-down with revenue, ad spend, ROAS, and Meta performance across 8 brands. Filterable by brand with radar charts and channel distribution analysis.

● Brand filtering ● Multi-channel
Modern retail brand lifestyle
Brand Analytics

Brand Deep Dive Dashboard

Per-brand funnel visualization with Meta and Google breakdowns, MoM trending, CPA analysis, and audience overlap diagnostics. Two-brand comparison view.

● Funnel visualization ● Dual-brand
Growth trend charts on screen
Longitudinal Forecasting

3-Year DTC Growth Trajectory

Multi-year revenue, ROAS, and ad spend visualization across top portfolio brands with forward-looking projections. Maps the evolution from $35M to $50M+ portfolio revenue.

● 2022-2025 data ● Forecasting
Documentation and process notes
Methodology & Process

Paid Media Reporting SOP v2.0

Standardized reporting framework with data validation checklists, classification systems, metric hierarchies, and template structures. Adopted as team operating standard.

● Team-adopted ● Scalable system

Built With

Google Analytics 4 Google Tag Manager React / Recharts Claude AI Cross-Platform Attribution BigQuery Salesforce Looker Studio